


Friday, 22 November 2013
Design Stage
Now that the analyst as all of the information needed recorded, it's the designer's turn. The designer will have to design the inputs & outputs of the system, database stores, process of the system, validation check and test data for the system.
However, the designer has to keep in mind several factors when designing the new system. He has to consider:-
1) The fluency and smoothness of the system, i.e. it should be easy to use, navigate through and not over-elaborate.
2) A ship won't sail without its captain. The new system has to contain guidelines & instructions and should be free of misleading figures.
3) The margin of error is so small and therefore, the designer should be well aware of them and has to limit the possibility of inaccurate data.

Imagine what would happen to the user if he found the system without these factors. He/She will definitely get a short-circuit & blow their fuses.
The format of the output can take various shapes, from which includes: graphs, reports, list of records and tables. The output can be produced on paper, on screen display and/or sound display.
* Why do you think sound display is an option over here?
There will be two files to be designed:-
1. Master file: This contains data which do not often change such as name, date of birth, gender, etc...
2. Transaction file: This one contains data which change often such hours worked, phone number(s), etc...
How to reduce errors? Can you think of a way to reduce them apart from validation? There are more ways around a door than a key. As a matter of fact, there are several ways in which you can do this:-
1) You can use the coding method to make the character length shortened. If you're not familiar with this method, coding is more like replacing an entire data with a letter or symbol. For example, you can write "Male" as "M" and "Female" as "F", "Yes" with a tick and "No" with a cross.
2) Alternatively, you can use direct input data. The next time you visit a supermarket, check the barcode on a product and how does the cashier use the POS (Point of Sale) to directly input the data to his computer. Scan the barcode and you're done, it's as simple as that.

System Analysis
So before anything happens to your system, it has to be analysed. This is the first stage of the SLC, analysis stage. To be clear & simple, system analysis means examining the existing system in detail.
There are four main & distinct ways to collect information:-
1. Examining of Paper Documents
2. Interview
3. Questionnaires
4. Observation
The pros & cons of each can be seen from this table:-

Now, which is the most effective method? Well actually, we can't judge by their names or functions. Judging the effectiveness of any of these methods depends on the situation.
Like for instance, a receptionist may be too busy to interview, so in this case you'd go for observation. In a case of a manager, you would like to probe for more feedback, more info, more stuff. Therefore, an interview would fit the bill.
If you have a large number of people, like employees or customers, would you choose to observe or interview. If you chose either, then you made a mistake. You can't interview or observe hundreds of thousands employees, can you? No, therefore questionnaires are most suitable where you can copy a lot of those questionnaires and send them to the workers.
Sometimes, none of the three methods above would give you an exact detail of a particular aspect. Let's say, the transaction details. The manager would not tell you those kind of details. For that, examining of papers is the method. You can refer to those papers to view all the transactions, the accounts, etc... .
Monday, 28 October 2013
Using Spreadsheets
Okay, so now you have a list of data recorded and saved as a CSV file and you want it as a spreadsheet. First of all, you've got to know a bit (or a lot) more about them before doing anything. So first things first.
1) What is Spreadsheets Modelling?
Spreadsheet Modelling is a computer program that allows you to create, edit and maintain full data. Note that the output depends on the input. Changing the input value will most certainly affect the output.
2) List three uses of Spreadsheets.
So you're wondering what those spreadsheets can do? Well, you can put it this way: It is used to design, perform calculations, produce high quality output; the fact is that it is actually used to predict the possible outcomes
3) What does CSV.File stand for.
You should be very aware that CSV stands for "Comma Separated Values". Forget this and see where that'll get you.
1) What is Spreadsheets Modelling?
Spreadsheet Modelling is a computer program that allows you to create, edit and maintain full data. Note that the output depends on the input. Changing the input value will most certainly affect the output.
2) List three uses of Spreadsheets.
So you're wondering what those spreadsheets can do? Well, you can put it this way: It is used to design, perform calculations, produce high quality output; the fact is that it is actually used to predict the possible outcomes
3) What does CSV.File stand for.
You should be very aware that CSV stands for "Comma Separated Values". Forget this and see where that'll get you.
Saturday, 19 October 2013
Friday, 18 October 2013
System Design (Home-Work Question)
When desigining a layout, the analyst will be influenced by the views of the users and their requirements. He'll need to consider who will see them. There will also need to be consultation with the owner(s) of the firm.
For screen forms, the analyst has to consider the attractiveness of the screen layout and its simplicity. The screen form should not be complicated for the users and it is heavily advised to include on-screen instructions on how to navigate from screen to screen.
The main aspects of the way output is designed is its output and the medium it is to be produced on.
The format could be: graphs, tables, reports or lists of records. The medium on the other hand could be a hardcopy (paper), a softcopy (screen display) and/or sound.
Sometimes, the designer will also want to consult customers via questionnaires in order to design the most suitable system for the firm. It is normal for system analysts to produce three or four different designs of an item output. When designing these, the analyst is fully aware of what the purposed system is capable of producing. The users of the system will also be asked for their views.
For screen forms, the analyst has to consider the attractiveness of the screen layout and its simplicity. The screen form should not be complicated for the users and it is heavily advised to include on-screen instructions on how to navigate from screen to screen.
The main aspects of the way output is designed is its output and the medium it is to be produced on.
The format could be: graphs, tables, reports or lists of records. The medium on the other hand could be a hardcopy (paper), a softcopy (screen display) and/or sound.
Sometimes, the designer will also want to consult customers via questionnaires in order to design the most suitable system for the firm. It is normal for system analysts to produce three or four different designs of an item output. When designing these, the analyst is fully aware of what the purposed system is capable of producing. The users of the system will also be asked for their views.
Tuesday, 21 May 2013
Using ICT in Project Management
Use of ICT in Project Management
_______________________________________
Why is it needed?
Time is the most important element and the one in shortest supply. For any project, it is essential that a business has to plan for it. Projects include: construction of a new building, designing an aircraft, starting up a business, etc... Would you imagine how carrying out the process would be if they were not planned?
How to manage a project?
There're simple applications which could be used for project management but there're sophisticated software's which are used for the purpose. However, the most popular tools now-a-days are the Gamtt & Pert Charts.
A PERT chart is a project management tool used to schedule, organize, and coordinate tasks within a project. PERT stands for Program Evaluation Review Technique, a methodology developed by the U.S. Navy in the 1950s to manage the Polaris submarine missile program.
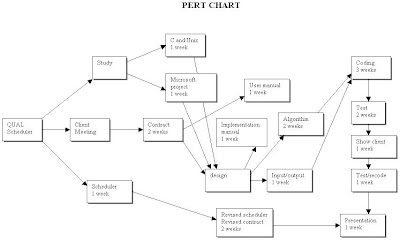
A Gantt chart is a type of bar chart, developed by Henry Gantt in the 1910s, that illustrates a project schedule. Gantt charts illustrate the start and finish dates of the terminal elements and summary elements of a project.Some Gantt charts also show the dependency (i.e. precedence network) relationships between activities. Gantt charts can be used to show current schedule status using percent-complete shadings and a vertical "TODAY" line as shown here.

Subscribe to:
Posts (Atom)


