Use of ICT in Project Management
_______________________________________
Why is it needed?
Time is the most important element and the one in shortest supply. For any project, it is essential that a business has to plan for it. Projects include: construction of a new building, designing an aircraft, starting up a business, etc... Would you imagine how carrying out the process would be if they were not planned?
How to manage a project?
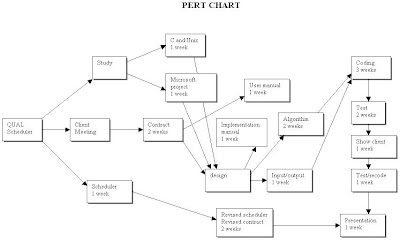
There're simple applications which could be used for project management but there're sophisticated software's which are used for the purpose. However, the most popular tools now-a-days are the Gamtt & Pert Charts.
A PERT chart is a project management tool used to schedule, organize, and coordinate tasks within a project. PERT stands for Program Evaluation Review Technique, a methodology developed by the U.S. Navy in the 1950s to manage the Polaris submarine missile program.


0 comments:
Post a Comment